The Data Practice team has been tasked with building data maturity within NSW Government. We’ve been experimenting with tools and technologies, and working to support agencies with their specific needs. A reoccurring theme in our discussions has been around how to prepare meaningful data visualisations. The way it’s data is visualised impacts how the audience understands and analyses trends or inconsistencies in the data.
Here are some tips to lead you to data visualisation success:
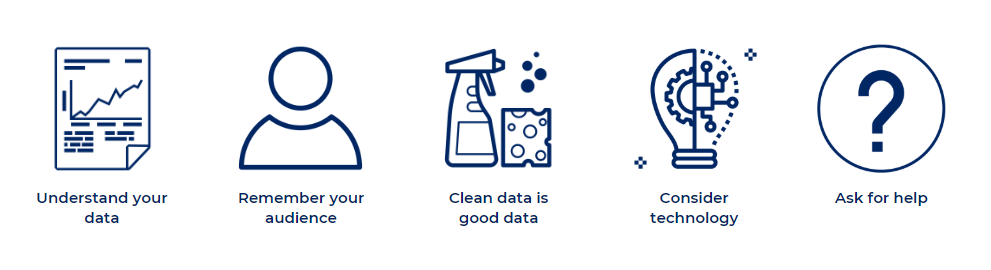
Understand your data
Before you start creating a visualisation of your data, it’s a good idea to invest some time in understanding what your metrics mean. If you don’t understand what your data is telling you, it’s unlikely that your audience will!
Remember your audience
Who is the visualisation for? Why are they looking at it? Building a visualisation with the needs of your audience in mind is arguably the most important part of the process.
Keeping your audience in mind will help you tailor the content to their needs. And if you’re not sure, you could always ask! Consulting your audience in the development phase of a prototype is a great way to make sure you stay on track. Remember, you may need to build multiple visualisations for various stakeholders based on the same dataset; sometimes one size doesn’t fit all.
Clean data is good
Invest time in cleaning your data set before you start work on a visualisation. There is nothing worse than coming up with a beautiful visualisation only to realise that the underlying data is full of gaps, incorrect data types or typos, rendering your work useless.
Consider technology
What technology are you going to use to design and deploy your visualisation? There are so many options (Tableau, DOMO, Data Studio, R Studio, Power BI are just some of them), each with their own pros and cons. Ultimately, the technology you choose will be dependent on your specific data and audience. Mapping out how each technology will connect to your data, prepare your preferred visualisations, deploy to your users and update over time, will help to safeguard against wasting time, and licensing fees in some cases, on a technology that is not fit for your purpose.
For more examples of data visualisations check out our Data.NSW data stories.
Last updated 24 Oct 2024